Research Article | | Peer-Reviewed

A Hybrid STL - GEV and RNNs Models Approach for Monthly Extreme Discharge Forecasting in the Mono Basin

Received: 24 May 2026     Accepted: 2 June 2026     Published: 23 June 2026
Views:       Downloads:
Abstract

Forecasting monthly extreme flows is a major challenge in hydrology due to their rarity and high intensity, particularly in tropical basins vulnerable to climate change. This study proposes an innovative hybrid approach combining STL decomposition, generalized extreme value (GEV) theory, and LSTM and GRU architectures to predict river flow: the case of the Mono River in Togo. The methodology is based on isolating the residual component, modeled by a GEV distribution, whose values are converted into probabilities using a cumulative distribution function. A unique feature of this approach is the incorporation of multivariate meteorological data. Unlike conventional approaches, the results show that the hybrid model particularly in its univariate sequential configuration reproduces extreme dynamics with a high degree of accuracy. The evaluation was conducted at various stations in Togo using the "Peak Over Threshold" approach, applied at the 75th percentile. At the Dotaicopé station, the model performed robustly, achieving an accuracy of 0.82, a recall of 0.74, an F1 score of 0.78, and a Kling-Gupta efficiency coefficient of 0.75. At the Tététou station, the multivariate model achieved an exceptional recall of 0.9, confirming its superior ability to detect critical thresholds in areas with high hydrological variability; the univariate model, on the other hand, performed less well in this regard, thereby demonstrating the significant contribution of climatic parameters. However, the study highlights a limitation related to data asymmetry, as climate forcings are only available starting in 1981, whereas discharge records date back to 1952. These results validate the potential of both univariate and multivariate probabilistic hybrid models for better characterization of hydrological regimes and early flood risk prevention.

Published in Journal of Water Resources and Ocean Science (Volume 15, Issue 3)
DOI 10.11648/j.wros.20261503.12
Page(s) 62-75
Creative Commons

This is an Open Access article, distributed under the terms of the Creative Commons Attribution 4.0 International License (http://creativecommons.org/licenses/by/4.0/), which permits unrestricted use, distribution and reproduction in any medium or format, provided the original work is properly cited.

Copyright

Copyright © The Author(s), 2026. Published by Science Publishing Group

Keywords

Forecasting, Extreme Streamflow, Hybrid Models, STL, GEV, LSTM-GRU

1. Introduction
Within a global context marked by intensifying climate change, a significant increase in both the frequency and intensity of extreme hydrological events has been widely observed . Although this phenomenon is global, its impacts are particularly critical across West Africa, a region defined by high hydroclimatic vulnerability . These disruptions manifest in contrasting ways: prolonged droughts in Sahelian zones on one hand, and a resurgence of severe floods in coastal regions on the other . This is notably the case in the Mono River basin, where riverine populations face increasingly devastating floods year after year . These extreme events exacerbate the socio-economic precariousness of the impacted areas, making hydrological characterization and forecasting essential to strengthen community resilience against increasingly uncertain and intense rainfall regimes .
To this end, several studies have been conducted in the Mono basin to evaluate various risk scenarios . However, predicting extreme floods remains highly complex due to their irregular, rare nature and their dependence on non-linear climate parameters . To estimate return periods, most traditional studies rely heavily on Generalized Extreme Value theory . More recently, analyses have extended these approaches over the 1960 - 2022 period within the Beninese portion of the basin , while other investigations utilized RCP 4.5 and 8.5 scenarios to project the future evolution of maximum discharge . These statistical frameworks have also been applied to investigate extreme precipitation in order to grasp the variability of local meteorological forcings .
Nevertheless, a major limitation persists: most of this research focuses on static statistical approaches within a dynamic climate system. It has become crucial to incorporate a temporal dimension to ensure operational monitoring and rapid response to flood events . In this light, the present study proposes to couple the GEV distribution with recurrent deep learning models, specifically Long Short-Term Memory (LSTM) and Gated Recurrent Unit (GRU) networks as well as sequential models to evaluate their accuracy in extreme flood forecasting. This hybrid approach, increasingly adopted for dynamic modeling and precipitation downscaling , bridges the probabilistic robustness of the GEV with the predictive capacity of neural networks. Previous works have demonstrated that leveraging a hybrid model combining STL decomposition, GEV distribution, and recurrent networks provides a significantly better characterization of hydroclimatic predictions .
The aims and contributions of this paper are summarized as follows. First, we propose a joint modeling framework that utilizes multivariate meteorological and hydrological data as inputs for sequential and recurrent time-series models (LSTM and GRU) to forecast monthly extreme streamflow, driven by a prior hybrid STL-GEV decomposition. Second, we systematically verify the contribution of climate parameters to extreme discharge characterization by comparing the multivariate configurations against a baseline univariate model built solely on historical discharge data. Third, we test the predictive framework across three distinct gauging stations, demonstrating that incorporating multivariate climate drivers significantly enhances model performance in highly volatile zones, such as the Tététou station, which typically exhibits poor predictability due to its severe high-flow regimes.
The paper is organized as follows. Section 2 details the methodological approach, covering the extraction of monthly maximums, the STL decomposition used to isolate residuals from predictable trends and seasonal components, and the statistical characterization of extremes via the GEV distribution combined with deep learning architectures using cumulative distribution functions. Section 3 describes the study area, the hydroclimatic datasets, and the performance metrics used for validation. In Section 4, we present the results and discussions, specifically comparing the efficiency of the univariate and multivariate setups. Section 5 concludes the paper and highlights future research directions.
2. Materials and Methods
2.1. Study Area
The Mono River Basin (Figure 1), situated in the Gulf of Guinea region, extends between latitudes 6.28° N and 9.39° N, and longitudes 0.62° E and 1.99° E. Straddling the Republic of Togo (89%) and the Republic of Benin (11%), it encompasses a total area of approximately 23,736.64 km². The basin is drained by its main watercourse, the Mono River, and hosts the Nangbéto hydroelectric dam, which features a reservoir with a maximum depth of 38 m (Amoussou, 2014).
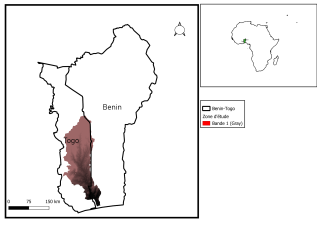
Figure 1. Location of the Mono River Basin.
2.2. Data
2.2.1. Hydrological Data
The discharge data used in this study cover the 1952–2023 period and are obtained from three hydrometric stations. Two are located upstream of the Nangbéto dam: Dotaicopé (1.27°E; 7.82°N) and Corrékopé (1.3°E; 7.8°N), while the Tététou station (1.53°E; 7.02°N) is situated downstream. These series, consisting exclusively of daily discharge records, are provided by the Directorate of Water Resources of the Ministry of Water and Sanitation of Togo. The dynamics of these records are illustrated in Figure 2, which presents the time series of the Tététou station.
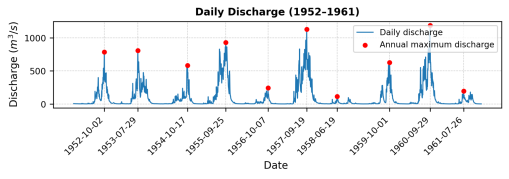
Figure 2. Visualization of daily discharge data at the Tététou station.
2.2.2. Meteorological Data
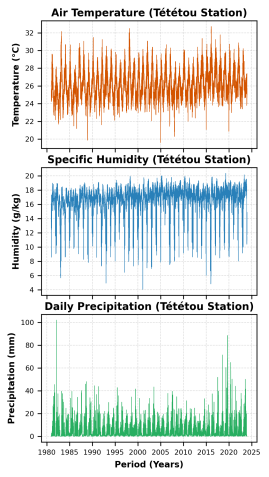
Figure 3. Daily evolution of temperature, specific humidity, and precipitation at the Tététou station.
The meteorological data are obtained from the NASA POWER platform, a standard reference for climatological studies . This service provides parameters tailored to agroclimatology and renewable energy applications, such as solar radiation flux . For the three selected stations (Dotaicopé, Corrékopé, and Tététou) in Figure 3, daily time series of precipitation, air temperature, and specific humidity (measured at 2 meters above ground level) were extracted using the "Single Point" option. Leveraging these multiple meteorological inputs is essential to improve hydrological model simulations, as combined multi-input frameworks significantly enhance streamflow predictability . Furthermore, integrating these concurrent variables allows deep learning architectures to capture hidden physical synergies across diverse datasets, as demonstrated by Kratzert et al. in optimizing rainfall-runoff modeling performance. This feature enabled the input of the exact geographic coordinates for each station. The extraction was executed in CSV format for a period extending from January 1981 to April 2026 for a period extending from January 1981 to April 2026.
2.3. Data Processing
Daily discharge series were aggregated into monthly maxima using Python's Pandas library by applying the "resample ('ME')" function. This approach allows for the characterization of extreme hydrological events within the basin. As illustrated in Figure 4 for the Tététou station, two major interruptions in data collection are observed: from 1996 to 1998 and from 2000 to 2016. These chronological gaps also affect the Corrékopé and Dotaicopé stations. Consequently, time series were segmented into two distinct periods: first, spanning from 1952 to 2000, constitutes the longest sequence and was used for the training (calibration) and validation of the LSTM and GRU models. Second, covering the period from 2016 to 2023, was reserved for the testing phase.
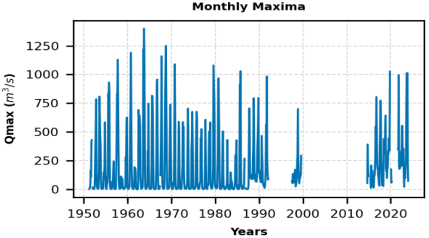
Figure 4. Visualization of monthly maximum discharge variations from 1952 to 2023, where the blank spaces highlight two major data gaps: the first from 1996 to 1998, and the second from 2000 to 2016.
Meteorological data were synchronized with the discharge series using an inner join based on the time variable. This alignment allows for the construction of continuous time sequences via a sliding window approach, where each input vector precisely matches the chronology of the observed flood events.
2.4. Model Architecture
We adopt a hybrid approach combining statistical decomposition and deep learning to model monthly maximum discharge. This approach consists of three steps: (1) signal decomposition using STL and GEV, (2) modeling via recurrent neural networks (RNNs) such as LSTM and GRU, and (3) final signal reconstruction.
2.4.1. Data Preprocessing and Transformation (STL-GEV)
In contrast to direct approaches using RNN models for discharge prediction , we opt for a method based on the decomposition of the discharge time series (Q) to isolate its physical components using STL method to extract the trend, seasonality, and residuals. To stabilize the learning of extreme events, the residuals are transformed using the Generalized Extreme Value (GEV) distribution. These residuals were converted into probability values using the cumulative distribution function (CDF) defined by equation (1):
yt=FGEVR|μ,σ,ε(1)
This transformation projects the extreme values into the interval between zero and one, thereby reducing the impact of outliers on the gradient descent during the training phase of the deep learning models."
2.4.2. Models Architecture: LSTM, GRU, and Sequential
To capture the complex temporal dependencies inherent in hydrological processes, a dense feedforward neural network and two types of recurrent neural networks (RNNs) LSTM and GRU were implemented and compared in this study. For the sequential dense models, a lightweight two-layer architecture with 16 neurons each was selected. This structure is specifically tailored to our sample size, covering the 1952–2023 period, to drastically mitigate the risk of overfitting.
For the LSTM and GRU architectures, a two-layer configuration was also maintained, featuring a variation in the number of neurons: 32 units with a hyperbolic tangent (tanh) activation function for the first layer, followed by 16 units for the second layer, activated by a rectified linear unit (ReLU) function. This choice introduces non-linearity into the feature extraction process. Finally, a single-target output layer equipped with a sigmoid activation function is utilized to predict the cumulative distribution function (CDF) value bounded between 0 and 1.
For model training, we employ a tail-weighted mean squared error loss function. Inspired by the work on extreme rainfall value theory by Niu et al., this approach assigns increased weight to probabilities close to unity, thereby optimizing model accuracy for simulating major flood events .
2.5. Metrics
2.5.1. The Custom Tail-weighted MSE Loss Function
To enhance the model's accuracy on extreme discharges, the Mean Squared Error (MSE) loss function was adapted to our dataset to heavily penalize errors on extreme values. This custom tail-weighting approach was inspired by the work of Niu et al. , who previously demonstrated its effectiveness on extreme precipitation events. This metric penalizes errors committed on extreme CDF values more severely. The loss function, denoted as L, is defined by equation (2):
Ly,ŷ=1ni=1nwi yi-ŷi2 (2)
where wi =α.yi-0.5p.
where n represents the number of observations, denotes the observed CDF value. Parameter α acts as an amplification factor, while ŷi is the predicted value. Parameter p dictates the sensitivity, modulating the importance assigned to values that deviate from the median (0.5). The advantage of this metric lies in its ability to constrain the model (LSTM, GRU or sequential) to prioritize accuracy on flood peaks, which are frequently underestimated by standard MSE loss functions.
2.5.2. Models Performances Evaluation Criteria
Model evaluation is based on a multi-criteria approach combining global statistical metrics and extreme event detection indicators. The model's capacity to reproduce the overall discharge dynamics is measured by the Nash-Sutcliffe Efficiency (NSE) coefficient defined by equation (3):
NSE=1-i=1n(Qobs,i - Qsim,i)²i=1n(Qobs,i - mean(Qobs))²(3)
Since the NSE is highly sensitive to high values, it is supplemented by a Peaks Over Threshold (POT) analysis to assess model reliability during rare events. For a defined flood threshold, we compute the Recall (the capacity to detect actual floods), the Precision (the probability that a predicted flood is accurate), and the F1-Score defined by equation (4), represents the harmonic mean of Precision and Recall (Equations (4) and (5)):
Recall = TPTP+FN      (4)
Precision = TPTP+FP (5)
F1=2.Precision * Rappel Precision + Rappel(6)
where TP, FP, and FN denote True Positives, False Positives, and False Negatives, respectively. This suite of indicators isolates the model's performance specifically on peak discharge values.
3. Results and Discussion
In this section, the graphical analysis focuses primarily on the results obtained at the Dotaicopé station for the hybrid STL-GEV-RNN models. This choice ensures visual clarity and avoids redundancy, as similar trends were observed across the other monitoring sites. The analysis begins with the evaluation of the univariate models, followed by an in-depth comparison with the multivariate configurations. Finally, a comprehensive comparative table synthesizing all performance metrics across all stations (Dotaicopé, Tététou, and Corrékopé) is presented to complete the study and support the discussion.
3.1. STL Decomposition
The STL decomposition allowed for the disaggregation of the monthly maximum discharge time series into three distinct components: seasonality, trend, and residuals (Figure 5). Isolating the residual component is crucial in this context, as it captures the variability of extreme events and flood signals left unexplained by regular annual cycles. The analysis of Figure 5(a) reveals periods of stationarity alongside a distinct upward trend after 2020, demonstrating a changing dynamic that requires continuous monitoring.
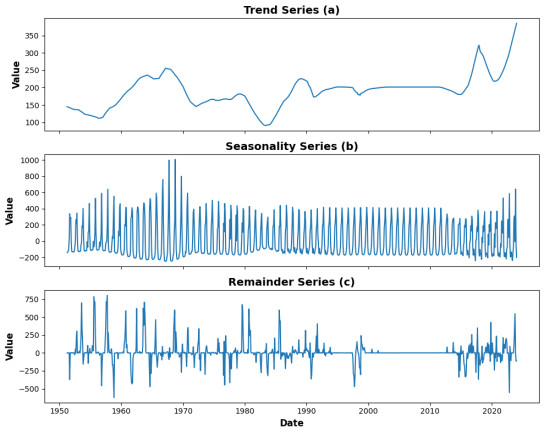
Figure 5. STL decomposition at the Dotaicopé station showcasing: (a) trend, (b) seasonality, and (c) residuals.
3.2. GEV Parameter Estimation
Fitting the GEV distribution to the residuals obtained from the STL decomposition allows for the statistical characterization of extreme events within the Mono River basin. The three estimated parameters are the shape parameter ξ, the location parameter μ, and the scale parameter σ. Together, they determine whether the hydrological regime follows a Gumbel, Frechet, or Weibull distribution.
It is crucial to note that the GEV implementation within Python's SciPy library utilizes an inverted sign convention for the shape parameter, defined as c=−ξ. Consequently, a negative value of c corresponds to a Frechet distribution, whereas a positive value indicates a Weibull distribution.
Table 1. Variation of the shape (ξ) parameter across the different hydrological stations.

Stations

c

ξ

Dotaicopé

0.08

-0.08

Corrékopé

-0.03

0.03

Tététou

-0.23

0.23

The results compiled in Table 1 reveal a marked variability in the shape parameter across the different stations, reflecting the spatial heterogeneity of discharge dynamics within the Mono River basin. This disparity is particularly pronounced at the downstream Tététou station, which exhibits a more contrasted hydrological regime. The Frechet-type shape parameter (ξ = 0.23) identified at this site indicates an increased probability of extreme flood occurrences, confirming the vulnerability of this specific zone to peak discharge events.
Beyond structural statistical characterization, fitting the GEV distribution enables the projection of the residuals (derived from the STL decomposition) into a probabilistic domain using the cumulative distribution function (CDF). This step is determinant for the modeling phase where it normalizes extreme fluctuations within a bounded interval between zero to one. By providing the LSTM model with structured input data focused on occurrence probabilities rather than raw magnitudes, neural network training is stabilized, thereby enhancing its capacity to capture the temporal dynamics of rare events.
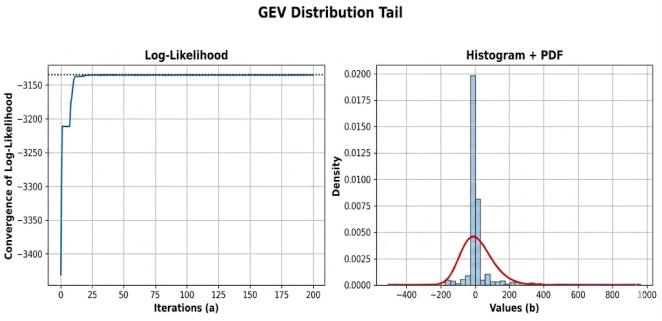
Figure 6. Convergence curve of the log-likelihood function for GEV parameter estimation (a); empirical histogram of the time series distribution overlaid with the fitted probability density function in red (b) at the Dotaicopé station.
3.3. Monthly Extremes Prediction
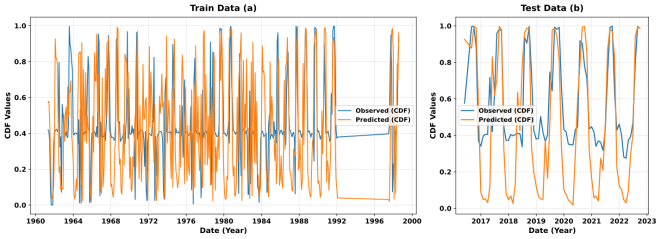
Figure 7. Evaluation of model fit on residuals within the CDF space. The fit is optimal on the training dataset (a), whereas an underestimation of extreme peaks is observed on the testing dataset (b).
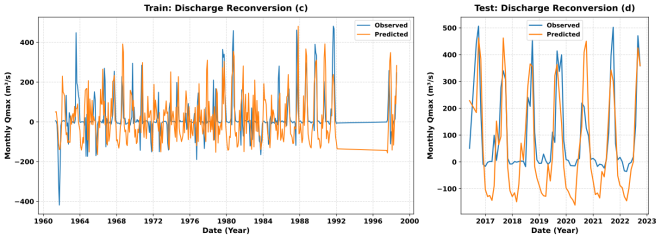
Figure 8. Reconversion of CDF values back into normalized discharge residuals based on the PDF.
The aim of this study is to leverage historical events to predict monthly extremes. To achieve this, the GEV distribution is applied using its cumulative distribution function (CDF), allowing for the estimation of the occurrence probability of each discharge value. This transformation maps the residuals discharge into probabilities bounded between 0 and 1, thereby facilitating the training of the sequential dense model as well as long-memory networks such as the LSTM and GRU to evaluate their respective performances across the entire dataset. These artificial neural networks effectively capture the complex relationships between input sequences and output probabilities.
The prediction strategy relies on decoupled processing: the model is trained separately on the residuals and the trend, after which the components are reconstructed to retrieve the actual discharge magnitudes. This approach enables the analysis of fluctuations at each level of the decomposition before evaluating the overall prediction performance.
The results highlight the robust capacity of the model to reproduce the time series dynamics within the probabilistic domain. During the training phase (Figure 7a), the tight alignment between the predicted and observed probabilities indicates that the network effectively captures the temporal structure of extreme events and peak discharges.
During the testing phase (Figure 8d), although the general morphology of the hydrological cycles is preserved, a notable overshoot of predictions towards negative values is observed. This phenomenon is a direct consequence of the aggressive nature of the α and p parameters in the custom loss function, which were initially calibrated to maximize extreme event detection. This high sensitivity is also manifested in the testing dataset within the CDF space (Figure 7b), where an overestimation of minimum discharge values is visible. Although the core priority of this study remains the penalization of errors on high magnitudes, a trade-off appears necessary to stabilize the model's behavior during low-flow periods and prevent these numerical artifacts, even if the latter do not constitute the primary objective of the forecasting framework.
Finally, it is critical to highlight a degradation in prediction quality when transitioning from the CDF space back to the actual, physical discharge magnitudes (Figure 8c and 8d). This drop in performance is mechanically justified by the amplification of residual errors from the probabilistic space during their reconversion via the inverse cumulative distribution function, or Percent Point Function (PPF). Indeed, within the heavy tails of the GEV distribution, minor variations in probability translate into significant discharge discrepancies within the physical domain.
The predictions performed on the trend and seasonal components prove to be highly effective. Notably, the strong convergence of troughs between the observed and predicted seasonality demonstrates the model's capacity to accurately capture the temporal cyclicity of river discharge. Similarly, observing the trend dynamics indicates that the model successfully tracks and forecasts both upward and downward shifts, despite a minor quantitative deviation from the actual values.
These dual analyses suggest that seasonality (representing regular, cyclic flows) and trends (reflecting slow, long-term evolution over time) are predictable phenomena. Properly modeling these components limits hazardous extreme variations within the residuals. This underscores the critical importance of the residual component, which encompasses highly variable fluctuations where extreme discharges are localized. Consequently, improving the prediction of these residual extremes remains the primary leverage to minimize the overall error rate across the entire discharge dataset.
Consequently, the modeling effort can focus almost exclusively on the residuals, which constitute the primary source of error and uncertainty in hydrological forecasting. Within this framework, minimizing the error on the residual component is mathematically equivalent to optimizing the reliability of the entire reconstituted time series (S + T + R). This decomposition approach, along with these results on seasonality and trends, validates our hybridization strategy focused on the residual signal, where the true complexity of extreme events resides.
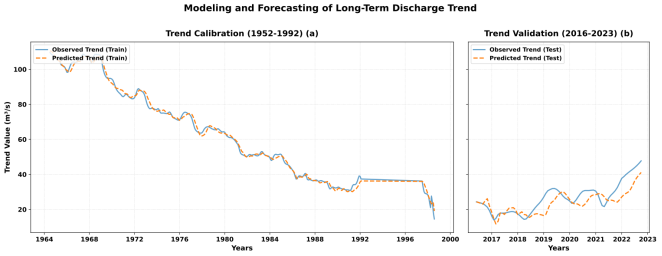
Figure 9. Prediction of series trends data (Train-Test validation). (a) Validation on training data, and (b) Validation on test data.
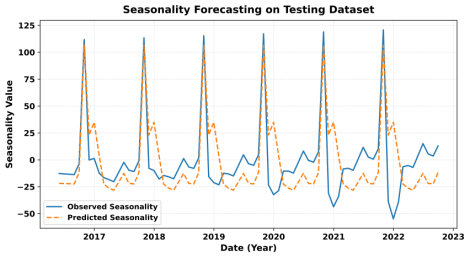
Figure 10. Seasonal component forecasting of the time series.
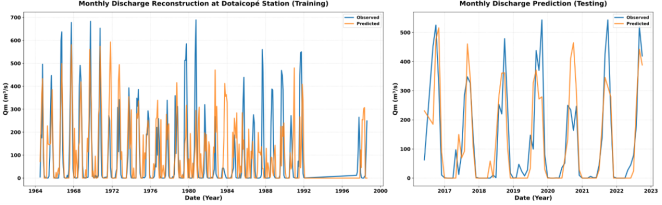
Figure 11. Flood forecasting based on reconstituted global discharge data. The left panel shows the prediction on the training dataset, while the right panel displays the forecasting on the test dataset for validation.
The analysis of Figure 11 confirms the relevance of the hybrid approach for simulating peak discharges. With the training phase serving as the calibration stage, the tight fit between observations and simulations demonstrates the sequential model's ability to assimilate the complex structure of the time series. In the testing phase, although a residual lag appears reflecting generalization challenges on unseen data, the model maintains a remarkable consistency with actual discharge dynamics.
To specifically evaluate the model's ability to detect extreme events, an approach based on the Peaks Over Threshold (POT) method was adopted. The 75th percentile of observed discharges was defined as the critical threshold for flood occurrence. The resulting classification performance is particularly robust, yielding a precision of 0.82, a recall of 0.74, and an F1-score of 0.78 when applying the sequential model architecture. These results indicate that the model successfully identifies nearly three-quarters of high-intensity events while minimizing the false positive rate, meaning that 82% of the predicted floods are actual events.
However, graphical analysis reveals two distinct phenomena: an underestimation of the magnitude of the most paroxysmal peaks alongside an overestimation of average floods (Figure 11). This behavior reflects the aggressive nature of the (α, p) loss function parameters, which struggle to achieve a compromise that proportionally penalizes errors across the entire distribution, as they were calibrated to prioritize extreme event detection at the expense of accuracy on minimum flows. It is important to emphasize that a standard Mean Squared Error (MSE) function produced heavily smoothed predictions, and that the limited sample size consisting of 70 years of monthly maximums restricts the number of available examples to optimize generalization across the different models. Furthermore, the mechanical amplification of errors during the reconversion from the probabilistic space to the physical domain via the Percent Point Function (PPF) explains the heightened sensitivity within the distribution tails. Despite these numerical constraints, the overall detection reliability confirms that these types of deep learning-based models constitute a promising decision-support tool for hydrological risk management in the Mono River basin.
Below is the comparative table of the various metrics evaluating the accuracy of our models, covering both univariate configurations (trained solely on historical discharge data) and multivariate configurations (incorporating meteorological data).
Table 2. Summary table of the different performance metrics across the discharge gauging stations.

Stations

Metrics

Models

LSTM

GRU

Sequential

Univariate

Multivariate

Univariate

Multivariate

Univariate

Multivariate

Dotaicopé

Precision

0.88

0.6

0.7

0.6

0.82

0.54

Rappel

0.4

0.9

0.6

0.9

0.73

0.6

F1-Score

0.6

0.75

0.6

0.72

0.77

0.57

MAE

72.88

118

82.75

99.6

63.64

97.06

RMSE

129.4

185

120.42

145

106.2

149.05

Corrékopé

Precision

0.76

0.72

0.7

0.6

0.6

0.85

Rappel

0.47

0.88

0.76

0.6

0.8

0.66

F1-Score

0.78

0.80

0.72

0.6

0.7

0.75

MAE

100

135.8

103.11

199.41

151.02

74.12

RMSE

156

216.57

157.5

240.32

267.2

119.49

Tététou

Precision

0.5

0.4

0.47

0.47

0.5

0.45

Rappel

0.6

0.6

0.44

0.44

0.8

0.9

F1-Score

0.56

0.5

0.45

0.45

0.6

0.6

MAE

200

232

237

237

216

246

RMSE

281

300.7

310

310

302

323

The cross-sectional analysis of the indicators confirms the relevance of the hybrid modeling strategy, with each architecture revealing specific strengths depending on the data structure of the station. For risk management-focused analysis, Recall was prioritized as the primary metric, as it measures the model's capacity to avoid omitting extreme events. In this regard, the results are compelling: while the Dotaicopé station displays a solid Recall of 0.73, the Tététou station, despite presenting more modest overall performance, stands out with a score of 0.90 using the multivariate sequential model surpassing by 0.1 the univariate sequential model, which stands at 0.80. In hydrological risk assessment, this marginal gain is highly significant, as it represents a crucial synchronization with flood peaks that would otherwise go undetected. This high sensitivity demonstrates that the system successfully identifies nearly all actual threshold crossings, thereby fulfilling an essential requirement for early warning systems.
The comparative analysis reveals the overall effectiveness of the univariate Sequential architecture, which offers the most stable compromise, with F1-scores ranging between 0.60 and 0.77. This simpler structure appears to better capture residual dynamics than recurrent models (LSTM/GRU) on short-duration time series. Nevertheless, the contribution of meteorological variables (NASA POWER) proves to be decisive depending on the location. At Corrékopé, the multivariate integration achieves a precision of 0.85, representing a significant improvement over the univariate model, which proves that rainfall and thermal forcings refine the model's ability to distinguish actual events.
Finally, the results highlight the hydrological heterogeneity of the Mono River basin. The Tététou station presents the largest mean errors (MAE and RMSE), with deviations reaching up to 310 m³/s for the RMSE, suggesting a more complex local dynamic or the influence of factors not integrated into the predictors. It is essential to highlight the difficulty in predicting extremes at Tététou, where observed precision metrics vary between 0.4 and 0.5, and the univariate recall metric is among the lowest (0.44). This implies that the models struggle to characterize extremes at this section due to highly variable hydraulics, as evidenced by the GEV shape parameter of 0.23, which indicates a heavy-tailed distribution. It is equally important to observe, however, that it is precisely at this station that the multivariate models (Sequential and LSTM) achieve their highest detection rates (Recall from 0.80 to 0.90). This demonstrates that, despite the difficulty in predicting the exact amplitude of the discharge, our models manage to synchronize their alerts with nearly all actual floods. This proves that, even if limited, exogenous parameters do contribute to the characterization of extreme events. Furthermore, it is important to emphasize the significant degradation in performance of the univariate models compared to the multivariate models when increasing the threshold value from the 75th to the 95th percentile. Collectively, these observations validate the effectiveness of the weighted loss function and the CDF transformation, which force the model to prioritize fidelity within the distribution tails to ensure enhanced monitoring of extreme phenomena.
4. Conclusion
This study aimed to propose an innovative hybrid approach combining STL statistical decomposition, Generalized Extreme Value (GEV) theory, and Sequential, LSTM, and GRU neural networks to forecast monthly extreme discharges in the Mono River basin. The originality of this method lies in the development of a hybrid framework blending statistical GEV theory with deep learning architectures, while explicitly evaluating the predictive enhancement provided by meteorological explanatory parameters.
The findings demonstrate the hybrid model's capacity to satisfactorily reproduce the overall temporal dynamics of the hydrological time series. Although an attenuation of peak magnitudes is observed during the reconversion from the CDF space back to actual discharges, the robustness of the approach is confirmed by solid performance indicators. The POT threshold analysis at the 75th percentile reveals record recall scores of 0.90 at Tététou and 0.74 at Dotaicopé for the multivariate models, along with robust F1-score performances. Regarding precision, values exceeding 0.80 were recorded at the Dotaicopé and Corrékopé stations using univariate and multivariate configurations respectively, proving that the associated meteorological parameters significantly contribute to extreme event estimation. The study also shows that multivariate models maintain higher reliability than univariate ones when increasing the threshold severity from the 75th to the 95th percentile. This remains true despite the reduced size of the training dataset, as the NASA POWER platform data are only available from 1982 onward, preventing the full utilization of the historical discharge records which begin in 1952. Nevertheless, it should be noted that the aggressive nature of the alpha and p parameters in the loss function, while effective for peak detection, can induce instabilities in low-flow values during physical reconversion. Ultimately, this hybrid model represents a promising milestone for improving early warning systems and enhancing resilience against extreme flood events in the region.
Abbreviations

POT

Peak over Threshold

STL

Seasonal-Trend Decomposition Using Loess

GRU

Gated Recurrent Unit

LSTM

Long Short Term Memory

MSE

Means Squirt Error

CDF

Cumulative Distribution Functions

GEV

Generalized Extreme Value

KGE

Kling-Gupta Efficiency

DRE

Direction Des Ressources En Eau

Author Contributions
Sama Essowé Silvin Souvenir: Conceptualization, Data curation, Investigation, Methodology, Software, Visualization, Writing – original draft
Sagna Koffi: Conceptualization, Methodology, Supervision, Validation, Writing – review & editing
Apeke Séna Kodjo: Formal Analysis, Writing – review & editing
Etho Kudzo Séna Salomon: Data curation
Data Availability Statement
1. The meteorological data that support the findings of this study can be found at: nasa power data.
2. The hydrological data is available from the DRE upon responsible request.
Conflicts of Interest
The authors declare no conflicts of interest.
References
[1] Gemenne F, Rankovic A, Michelitsch L. Climate change, natural disasters and population displacements in West Africa. ORBI (University of Liege), 2017. URL:
[2] Zbigniew W. Flood risk and climate change: global and regional perspectives. Hydrological Sciences Journal, 2013.
[3] Kaboré PN, Ouédraogo A. Characterization of climate variability in the North Central region of Burkina Faso from 1961 to 2015. Climatologie, 2017.
[4] Kosmowski F, et al Observations and perceptions of climate change: comparative analysis in three West African countries. IRD Documentation, 2015. Fdi: 010068393.
[5] Nouaceur Z. The return of rains and the resurgence of flooding in the Sahel region of West Africa. Physio-Geo. Physical Geography and Environment, 2020.
[6] Amoussou E. Hydrometeorological analysis of floods in the Mono River basin in West Africa using a conceptual rainfall-runoff model. HAL SHS, 2014. URL:
[7] Sow A, Thiaw A. The effects of climate change on household incomes in Africa. International Journal of Economics and Management Sciences, 2024. URL:
[8] Mouleye IS, Diaw A, Daouda YH. Effects of climate change on poverty and inequality in sub-Saharan Africa. Development Economics Review, 2019. HAL Id: halshs-01143318, version 1.
[9] Bessan MV, Vissin EW. Analysis of trends in extreme rainfall in the department of Mono, Republic of Benin. International Journal of Innovation and Applied Studies, 2025. URL:
[10] Amoussou E, Tramblay Y, Totin HSV, Mahé G, Camberlin P., Flood dynamics and modeling in the Mono basin at Nangbeto. Hydrological Sciences Journal, 2014.
[11] Jalbert J. Development of a non-stationary and regional statistical model for extreme precipitation simulated by a numerical climate model. Ph.D. thesis, Grenoble Alpes University & Laval University (Quebec, Canada), 2015. URL:
[12] Koungbanane D, Zahiri PE, Totin Vodounon HS, Amoussou E, Lare LY, Koubodana HD. Afrique SCIENCE, 2020.
[13] Houngue NR. Assessment of Mid-Century Climate Change Impacts in Mono River’s Downstream Inflows. Ph.D. thesis, WASCAL, 2018. URI:
[14] Amoussou E, et al. Evolution of extreme rainfall in the Mono watershed in a context of variability/change. Actes de Colloque, 2014.
[15] Sha Y, Sobash RA, Gagne II DJ. Improving Ensemble Extreme Precipitation Forecasts Using Generative Artificial Intelligence. Artificial Intelligence for the Earth Systems, 2025.
[16] Arnbjerg-Nielsen K, Fleischer HS. Feasible adaptation strategies for increased risk of flooding in cities due to climate change. Water Science and Technology, 2009.
[17] Tran Anh D, Van SP, Dang TD, Hoang LP. Downscaling rainfall using deep learning long short-term memory and feedforward neural network. International Journal of Climatology, 2019.
[18] Martel JL, Arsenault R, et al. Exploring the ability of LSTM-based hydrological models to simulate streamflow time series for flood frequency analysis. Hydrology and Earth System Sciences, 2025.
[19] Liu X, Ning Z, Guo J, Guo B. Prediction of Monthly Precipitation over the Tibetan Plateau based on LSTM Neural Network. Journal of Geo-information Science, 2020.
[20] Yin H, et al. Rainfall-runoff modeling using LSTM-based multi-state-vector sequence-to-sequence model. Journal of Hydrology, 2021.
[21] Dieng D. Modeling extreme events in time series prediction. Master's thesis at EURIA, 17 Juin 2018.
[22] Sousa Araújo A, Silva AR, Zárate LE. Extreme precipitation prediction based on neural network model - A case study for southeastern Brazil. Journal of Hydrology, 2022.
[23] Niu H. Tail-Aware Forecasting of Precipitation Extremes Using STL-GEV and LSTM Neural Networks. Hydrology, 2025.
[24] NASA POWER Project. NASA Prediction Of Worldwide Energy Resources (POWER) Data Access Viewer. Available at:
[25] Bai J, Chen X, Dobermann A, Yang H, Cassman KC, Zhang F. Evaluation of NASA satellite- and model-derived weather data for simulation of maize yield potential in China. Agronomy Journal, 2010.
[26] Jasinski MF, Borak J, Kumar SV, Mocko DM, Peters-Lidard CD, Rodell M, Rui H, et al. NCA-LDAS: Overview and Analysis of Hydrologic Trends for the National Climate Assessment. Journal of Hydrometeorology, 2019.
[27] Hegyi B, Stackhouse PW, Taylor P, Patadia F. NASA POWER: Providing Present and Future Climate Services Based on NASA Data for the Energy, Agricultural, and Sustainable Buildings Communities. In: American Meteorological Society Annual Meeting, 2024.
[28] Li P, Zhang J, Krebs P. Prediction of flow based on a CNN-LSTM combined deep learning approach. Water, 2022.
[29] Arsenault R, Essou GRC, Brissette FP. Improving hydrological model simulations with combined multi-input and multimodel averaging frameworks. Journal of Hydrologic Engineering, 2017.
[30] Wang YY, Wang W, Chau LW, Xu DM, Zang HF, Liu CJ, Ma Q. A new stable and interpretable flood forecasting model combining multi-head attention mechanism and multiple linear regression. Journal of Hydroinformatics, 2023.
[31] Kratzert F, Klotz D, Hochreiter S, Nearing GS. A note on leveraging synergy in multiple meteorological data sets with deep learning for rainfall–runoff modeling. Hydrology and Earth System Sciences, 2021.
[32] Kratzert F, Klotz D, Brenner C, Schulz K, Herrnegger M. Rainfall–runoff modelling using Long Short-Term Memory (LSTM) networks. Hydrology and Earth System Sciences, 2018.
Cite This Article
  • APA Style

    Souvenir, S. E. S., Koffi, S., Kodjo, A. S., Salomon, E. K. S. (2026). A Hybrid STL - GEV and RNNs Models Approach for Monthly Extreme Discharge Forecasting in the Mono Basin. Journal of Water Resources and Ocean Science, 15(3), 62-75. https://doi.org/10.11648/j.wros.20261503.12

    Copy | Download

    ACS Style

    Souvenir, S. E. S.; Koffi, S.; Kodjo, A. S.; Salomon, E. K. S. A Hybrid STL - GEV and RNNs Models Approach for Monthly Extreme Discharge Forecasting in the Mono Basin. J. Water Resour. Ocean Sci. 2026, 15(3), 62-75. doi: 10.11648/j.wros.20261503.12

    Copy | Download

    AMA Style

    Souvenir SES, Koffi S, Kodjo AS, Salomon EKS. A Hybrid STL - GEV and RNNs Models Approach for Monthly Extreme Discharge Forecasting in the Mono Basin. J Water Resour Ocean Sci. 2026;15(3):62-75. doi: 10.11648/j.wros.20261503.12

    Copy | Download

  • @article{10.11648/j.wros.20261503.12,
      author = {Sama Essowé Silvin Souvenir and Sagna Koffi and Apeke Séna Kodjo and Etho Kudzo Séna Salomon},
      title = {A Hybrid STL - GEV and RNNs Models Approach for Monthly Extreme Discharge Forecasting in the Mono Basin},
      journal = {Journal of Water Resources and Ocean Science},
      volume = {15},
      number = {3},
      pages = {62-75},
      doi = {10.11648/j.wros.20261503.12},
      url = {https://doi.org/10.11648/j.wros.20261503.12},
      eprint = {https://article.sciencepublishinggroup.com/pdf/10.11648.j.wros.20261503.12},
      abstract = {Forecasting monthly extreme flows is a major challenge in hydrology due to their rarity and high intensity, particularly in tropical basins vulnerable to climate change. This study proposes an innovative hybrid approach combining STL decomposition, generalized extreme value (GEV) theory, and LSTM and GRU architectures to predict river flow: the case of the Mono River in Togo. The methodology is based on isolating the residual component, modeled by a GEV distribution, whose values are converted into probabilities using a cumulative distribution function. A unique feature of this approach is the incorporation of multivariate meteorological data. Unlike conventional approaches, the results show that the hybrid model particularly in its univariate sequential configuration reproduces extreme dynamics with a high degree of accuracy. The evaluation was conducted at various stations in Togo using the "Peak Over Threshold" approach, applied at the 75th percentile. At the Dotaicopé station, the model performed robustly, achieving an accuracy of 0.82, a recall of 0.74, an F1 score of 0.78, and a Kling-Gupta efficiency coefficient of 0.75. At the Tététou station, the multivariate model achieved an exceptional recall of 0.9, confirming its superior ability to detect critical thresholds in areas with high hydrological variability; the univariate model, on the other hand, performed less well in this regard, thereby demonstrating the significant contribution of climatic parameters. However, the study highlights a limitation related to data asymmetry, as climate forcings are only available starting in 1981, whereas discharge records date back to 1952. These results validate the potential of both univariate and multivariate probabilistic hybrid models for better characterization of hydrological regimes and early flood risk prevention.},
     year = {2026}
    }
    

    Copy | Download

  • TY  - JOUR
    T1  - A Hybrid STL - GEV and RNNs Models Approach for Monthly Extreme Discharge Forecasting in the Mono Basin
    AU  - Sama Essowé Silvin Souvenir
    AU  - Sagna Koffi
    AU  - Apeke Séna Kodjo
    AU  - Etho Kudzo Séna Salomon
    Y1  - 2026/06/23
    PY  - 2026
    N1  - https://doi.org/10.11648/j.wros.20261503.12
    DO  - 10.11648/j.wros.20261503.12
    T2  - Journal of Water Resources and Ocean Science
    JF  - Journal of Water Resources and Ocean Science
    JO  - Journal of Water Resources and Ocean Science
    SP  - 62
    EP  - 75
    PB  - Science Publishing Group
    SN  - 2328-7993
    UR  - https://doi.org/10.11648/j.wros.20261503.12
    AB  - Forecasting monthly extreme flows is a major challenge in hydrology due to their rarity and high intensity, particularly in tropical basins vulnerable to climate change. This study proposes an innovative hybrid approach combining STL decomposition, generalized extreme value (GEV) theory, and LSTM and GRU architectures to predict river flow: the case of the Mono River in Togo. The methodology is based on isolating the residual component, modeled by a GEV distribution, whose values are converted into probabilities using a cumulative distribution function. A unique feature of this approach is the incorporation of multivariate meteorological data. Unlike conventional approaches, the results show that the hybrid model particularly in its univariate sequential configuration reproduces extreme dynamics with a high degree of accuracy. The evaluation was conducted at various stations in Togo using the "Peak Over Threshold" approach, applied at the 75th percentile. At the Dotaicopé station, the model performed robustly, achieving an accuracy of 0.82, a recall of 0.74, an F1 score of 0.78, and a Kling-Gupta efficiency coefficient of 0.75. At the Tététou station, the multivariate model achieved an exceptional recall of 0.9, confirming its superior ability to detect critical thresholds in areas with high hydrological variability; the univariate model, on the other hand, performed less well in this regard, thereby demonstrating the significant contribution of climatic parameters. However, the study highlights a limitation related to data asymmetry, as climate forcings are only available starting in 1981, whereas discharge records date back to 1952. These results validate the potential of both univariate and multivariate probabilistic hybrid models for better characterization of hydrological regimes and early flood risk prevention.
    VL  - 15
    IS  - 3
    ER  - 

    Copy | Download

Author Information
  • Regional Center of Excellence for Electricity Master (CERME), University of Lomé, Lomé, Togo

    Biography: Sama Essowé Silvin Souvenir is a software engineer and PhD student in Applied Physics, specializing in Electrophysics at the Regional Center of Excellence for Electricity Mastery (CERME), University of Lome. With several years of experience, he specializes in Artificial Intelligence modeling and data analysis, notably completing a research internship focused on radiological image segmentation for prostate tumor detection using radiomics. As part of his doctoral research, Sama Essowé Silvin Souvenir explores the analysis and modeling of flood-prone areas upstream and downstream of the Nangbéto dam, addressing the risks of flooding and dam failure under the supervision of Professor Sagna Koffi.

    Research Fields: Computer vision and image segmentation, Machine learning in medical imaging, Artificial intelligence for flood forecasting, Deep learning for time series analysis, Fluid dynamics and numerical simulation

  • Regional Center of Excellence for Electricity Master (CERME), University of Lomé, Lomé, Togo;Department of Physics, Faculty of Sciences, University of Lomé, Lomé, Togo

    Biography: Sagna Koffi is an Associate Professor in the Department of Physics at the Faculty of Sciences, University of Lome, Togo. Specializing in materials physics, fluid mechanics, and energetics, his research primary focuses on thermodynamic modeling, numerical simulations, and transport phenomena. He is particularly renowned for his work on the thermodynamic properties and evaporation processes of isolated droplets under critical, subcritical, and supercritical thermal environments, a crucial field for optimizing energy systems and internal combustion chambers. As a researcher at the Solar Energy Laboratory and an expert at the Regional Center of Excellence for Electricity Mastery (CERME), he supervises various doctoral research projects. His scientific contributions include numerous international publications addressing fluid dynamics, multiphase interface behaviors, and renewable energy integration.

    Research Fields: Thermodynamics of isolated fluid droplets, Numerical simulation of fluid mechanics, Energy systems and transport phenomena, Heat and mass transfer processes, Evaporation modeling in critical environments, Environmental pollution, Thermal engineering and materials physics

  • Ecole Polytechnique de Lome (EPL), University of Lomé, Lomé, Togo

    Biography: Apeke Séna Kodjo is a Lecturer and Research Scientist in the Department of Computer Science at the Ecole Polytechnique de Lome (EPL), University of Lome, Togo. He completed his PhD in Applied Mathematics and Computer Vision from the University of Western Brittany (Brest, France), conducting his doctoral research at the Laboratory of Medical Information Processing (LaTIM - INSERM). His research primary focuses on mathematical modeling, artificial intelligence, data science, and computer vision, featuring significant applications in tumor growth modeling for healthcare and predictive analysis in agriculture.

    Research Fields: Mathematical modeling and statistical analysis, Computer vision and image segmentation, Deep learning for predictive analytics, Artificial intelligence in smart energy management, Data science for agricultural prediction, Statistical machine learning applications

  • Water Resources Directorate, Ministry of Water and Sanitation, Lomé, Togo